
Clinical Research Tools – Kaplan–Meier Event Extraction
Kaplan–Meier curves are a core analytical tool in clinical research whenever outcomes are measured as time to an event, such as disease progression, hospitalization, device failure, or survival. They provide a rigorous way to summarize how risk evolves over time while properly accounting for censored observations and variable follow-up, which are common in real-world studies. As a result, Kaplan–Meier analyses play a central role in treatment comparison, safety assessment, and regulatory decision-making across a wide range of therapeutic areas and study designs.
When clincial trial results are published, typically the explicit event list is not included only the Kaplan Meier plot and usually acompanied by a high-level numbers at risk table. However, to evaluate in fine detail these clincial trial results (for making markov models for example) we often want an explicit list of the events times. For this reason we built a system using a purpose-built deep learning model to automatically identify and localize discrete event points within Kaplan–Meier survival curves at pixel-level precision.
At its core, the model applies a modern convolutional neural network architecture trained specifically on survival plot imagery. Rather than relying on brittle rule-based heuristics or manual annotation, the model learns the visual structure and geometry of Kaplan–Meier curves directly from data. It produces a dense probability map over the image, highlighting the most likely locations of stepwise event drops.
A specialized post-processing stage then converts this probability map into precise event coordinates, ensuring robust performance across varying plot styles, resolutions, and noise conditions. The system preserves exact spatial alignment with the original image, enabling accurate downstream analysis and seamless integration into automated workflows.
This approach combines the reliability of established computer vision techniques with domain-specific optimization, delivering consistent, reproducible results that scale far beyond manual extraction methods.
Version 1 of the model can be found below. We are currently making adaptations to 1) improve the accuracy - for example processing multiple tiles of the KM image should help and 2) reduce the effort for the user (no need to clip the image, and process multiple KM curves cimultaneously etc). If there is any particular feature you would like included please contact us at contact@catalyscope.com, and we’ll do our best to incorporate it as quickly as possible.
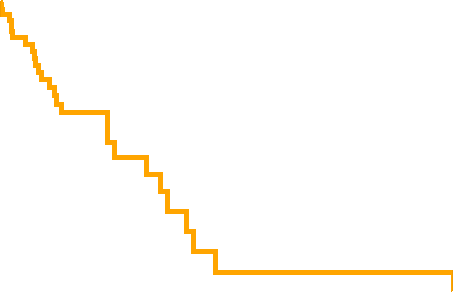
Usage Instructions: In order for the model to work optimally it is important to only analyse one Kaplan Meier curve at a time and to clip the image exactly between survival 0% and 100% of the y-axis and between time 0 and time x (to be inputted on the form) on the x-axis. See the before and after examples below. You must select whether your KM image contains censors or not as we have two separate models trained on such datasets and the best accuracy will result from the appropriate model being utilized.
Before
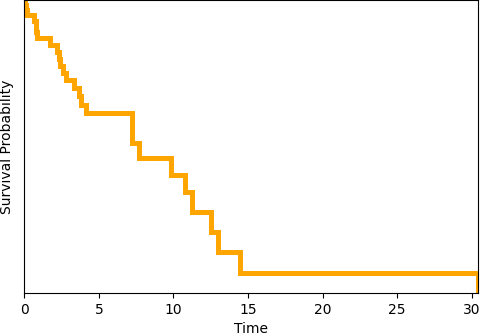
After
Upload KM Curve Image for KM Decoder v1
This tool is provided for research and educational purposes only. CatalyScope does not guarantee the accuracy of extracted event coordinates. Users are responsible for validating outputs prior to use in academic, regulatory, clinical, or commercial applications.